Welcome to the Orange County Baseline Community Food System Assessment (updated and published in 2026).
The first edition of this document was first published in 2016 and was authored by Sophie Kelmenson, MCRP, and Sarah Prager, MPH, at the direction of the Orange County Food Council. This second edition builds off of their extraordinary work with significant updates to reflect changes in the food system since that time. A special thanks to those who contributed to the original 2016 edition including:
- Brennan Bouma, Maureen Berner, Claire Hannapel, Mike Lanier, Gini Bell, Mike Ortosky, Hannah Pettus, Molly DeMarco, James Watts, Muriel Williman, Jared Cates, Orange County Food Council Task Force, Katherine Thompson, Patrick Mateer, Kelly Owensby, Stan Holt, Larissa Calancie, Transplanting Traditions, Margaret Krome-Lukens, Valerie Green, UNC Food For All Grant.
Thank you to the following individuals who contributed to this updated 2026 edition of the report.
- Jonathon Smith, Sue Ellsworth, Cody Lee, Mike Ortosky, Jordan Forbis, Karissa Scott, Chris Hirni, Jessica Perrin, Dana Hall, Cheryl Young, Mart Bumgarner, Amy Eckberg, Allie Omens, Rachel Potts, Suzanne Hitt, Shenae McPherson, Nora Dicker, Rachel Bearman, Ashton Tippins, Erin Riney, Kay Stagner, Renna Voss, Chloe Sherer, Maggie Funkhouser, Amanda Garner, Kristin Lavergne, Kate Underhill, Corly Jones, Jennifer Woods.
Questions about this report should be directed to Orange County Cooperative Extension Director Jonathon Smith at 919-245-2057 or jonathon_smith@ncsu.edu.
Understanding Orange County: A Foundation for Food System Insights
A sustainable and healthy local food system is deeply rooted in its community. To truly understand Orange County's food system, we must first examine the unique characteristics of its residents, its historical context, and the opportunities present within the area. This section provides a concise overview of Orange County's demographics and key quality of life indicators, laying the groundwork for a more comprehensive understanding of its food landscape.
Population and Demographics
Orange County's population was estimated at 152,877 people in 2024, with a projected overall growth of 6.5% between 2020 and 2030, according to the North Carolina Office of State Budget and Management. The racial composition of the county is predominantly White at 75.5%, followed by Black residents at 12.2%, Asian residents at 8.7%, and individuals identifying as two or more races at 2.8%. Additionally, 10.5% of the population identifies as Hispanic or Latino.
Gender distribution, based on the 2023 American Community Survey (5-Year Estimates Data Profile), shows that 52.2% of the population is female and 47.8% is male. The county's population is largely comprised of working-age adults, with 64.9% aged between 18 and 64 years old.
Economic Landscape and Affordability Challenges
Orange County stands out economically, ranking 2nd in the state for per capita income and 3rd for average weekly wage, which is 114% of the state average. The median household income has seen an increase, rising from $77,763 in 2014 to $88,553 in 2024 (both values adjusted to 2025 inflation). This represents a notable increase despite a cumulative inflation rate of 32.43% from 2014 to 2024.
However, despite these strong economic indicators, a significant challenge remains: the median household income in Orange County falls below the living income standard of $111,040 for households with two adults and two children. This critical gap indicates that many households struggle to earn enough to afford an adequate standard of living, a challenge exacerbated by Orange County's higher cost of living compared to much of North Carolina.
The county faces some of the highest living expenses in the state. Orange County ties with Chatham and Durham Counties for the highest monthly housing costs among all 100 North Carolina counties. It also holds the distinction of being the second highest cost county for monthly childcare. Furthermore, Orange County ranks as the second highest cost county for monthly taxes, tying with Chatham and Wake Counties and just $30 below the average monthly taxes in Union County.
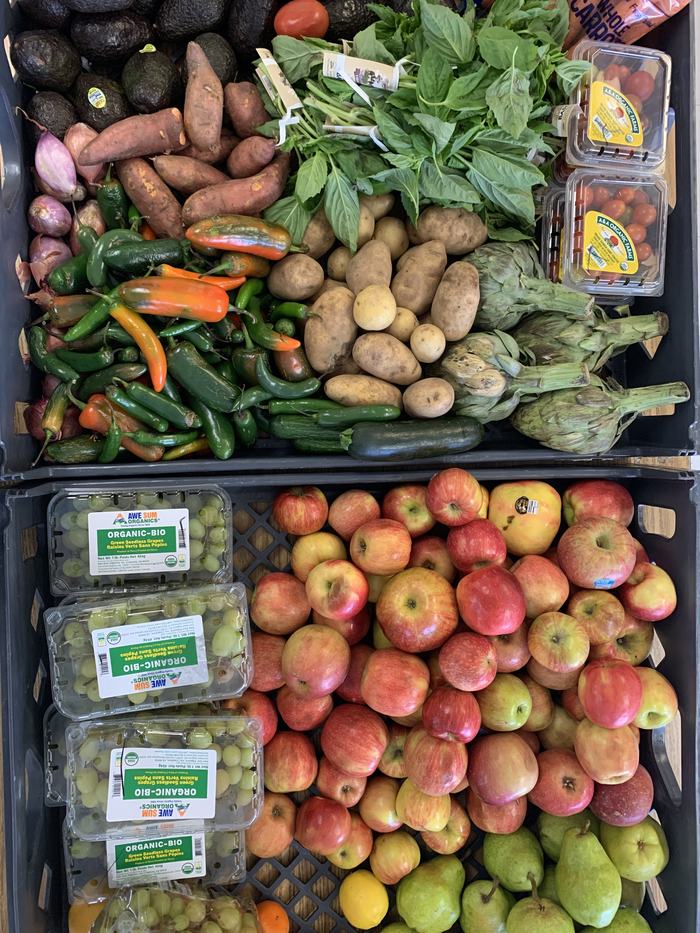
Fresh vegetables and fruits donated to Heavenly Groceries, a partnership between St. Joseph Christian Methodist Episcopal Church and the Marian Jackson Center in Chapel Hill's historic Northside neighborhood.
Photo provided by Heavenly Groceries.
Poverty and Vulnerable Populations
According to the U.S. Census Bureau, 12.7% of the Orange County population is below the poverty level. 5.2% of all families with children under the age of 18 in Orange County had incomes below the poverty level in the past 12 months . The poverty rate varies across age groups: 8.0% for adults 65 years and over, and 15.5% for individuals aged 18 to 64 years . Since 2010, the poverty rate for all individuals has decreased from 16.3% to 12.7% .
A specific vulnerable population in the county includes an estimated 710 grandfamilies, where grandparents are primarily responsible for raising their grandchildren .
The Massachusetts Institute of Technology Living Wage Calculator further illustrates the financial strain: the living wage in Orange County for parents in a two-parent, two-child household is $30.56 per hour, significantly higher than the poverty wage of $7.93 per hour and the North Carolina minimum wage of $7.25 per hour .
Important Acronyms to Know
ACS American Community Survey
CEP Community Eligibility Provision
CHCCS Chapel Hill-Carrboro City Schools
CSA Community Supported Agriculture
CSFP Commodity Supplemental Food Program
DTC Direct-To-Consumer
EBT Electronic Benefit Transfer
EVAD Enhanced Voluntary Agriculture District
FNS Food and Nutrition Services
FPL Federal Poverty Level
NCDA&CS North Carolina Department of Agriculture & Consumer Services
OCS Orange County Schools
OCSW Orange County Solid Waste
PFPC Piedmont Food Processing Center
PUV Present Use Value
SFA School Food Authority
SFSP Summer Food Service Program
SNAP Supplemental Nutrition Assistance Program
TEFAP The Emergency Food Assistance Program
VAD Voluntary Agriculture District
USDA United States Department of Agriculture
WIC Women, Infants, and Children
What is a Food System?
This assessment utilizes a food system model adapted by Christy Shi from Cornell University’s Discovering the Food System: A Primer on Community Food Systems. This framework organizes the complex local food economy into seven key sectors: production, distribution and aggregation, processing, marketing, purchasing, consumption, and resource recovery. The accompanying diagram illustrates how many of Orange County’s specific assets are integrated into these sectors.
As an urban county that maintains a robust rural character, Orange County possesses a diverse array of food assets that present unique opportunities for both economic growth and system resilience. By exploring each segment of the supply chain through this lens, readers can better understand the county's current strengths, emerging opportunities, and persistent challenges. For additional context on these supply chain dynamics, please visit the NC State Extension Local Food Program webpage at localfood.ces.ncsu.edu.
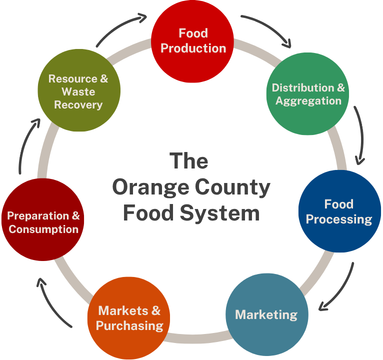
The Orange County Food System consists of 7 major components that interact and impact one another, driving the local food system. Orange County has a wide variety of resources in all areas of the system.
| Key Sector | Examples of Assets Present In Orange County or Regionally |
| Food Production |
|
| Distribution & Aggregation |
|
| Food Processing |
|
| Marketing |
|
| Markets & Purchasing |
|
| Preparation & Consumption |
|
| Resource & Waste Recovery |
|
Click on the icons below to view additional components of the assessment.
Works Cited
1 U.S. Census Bureau. (n.d.). QuickFacts: Orange County, North Carolina. U.S. Department of Commerce. Retrieved February 27, 2025, from https://www.census.gov/quickfacts/orangecountynorthcarolina.
2 North Carolina Office of State Budget and Management. (2026, January 30). Population growth 2020-2030. https://www.osbm.nc.gov/facts-figures/population-demographics/state-demographer/countystate-population-projections/population-growth-2020-2030.
3 North Carolina Association of County Commissioners. (2024). 2024 NCACC county map book. https://indd.adobe.com/view/3f0db37e-7e56-4b42-9a16-b6a218100a6a.
4 U.S. Bureau of Labor Statistics. (n.d.). CPI inflation calculator. https://www.bls.gov/data/inflation_calculator.htm.
5 Rockefeller Harris, L., & Umbarger, M. (2025, January 8). 2025 Living Income Standard. NC Budget & Tax Center. https://ncbudget.org/2025-living-income-standard/.
6 U.S. Census Bureau. (2024). Primary families by family type, presence of own children under 18 years, and poverty status in the past 12 months (Table S1702). U.S. Department of Commerce. Retrieved [Month Day, Year], from https://data.census.gov/table/ACSST1Y2024.S1702?q=Orange+County,+North+Carolina&t=Income+and+Poverty.
7 U.S. Census Bureau. (2024). Poverty status in the past 12 months: 2024 ACS 1-year estimates subject tables (Table S1701). https://data.census.gov/table/ACSST1Y2024.S1701?q=Orange+County,+North+Carolina&t=Income+and+Poverty.
8 U.S. Census Bureau. (2024). Grandparents as caregivers, 2024 American Community Survey 1-year estimates (Table B10002). U.S. Department of Commerce. Retrieved October 23, 2024, from https://data.census.gov/table/ACSDT1Y2024.B10002?q=Orange+County,+North+Carolina+grandparent+responsible.
9 Glasmeier, A. K. (2024). Living wage calculation for Orange County, North Carolina. MIT Living Wage Calculator. https://livingwage.mit.edu/counties/37135.
10 Shi, C. (2002). Discovering the food system: A primer on community food systems. Cornell University, Department of Education.